 +
+ 
Integrating AbuseIPDB with Splunk©
Integrating AbuseIPDB with Splunk©
AbuseIPDB provides free and premium APIs for reporting and checking IP addresses. Every day webmasters, system administrators, and other IT professionals use our API to report thousands of IP addresses engaging spamming, hacking, vulnerability scanning, and other malicious activity in real time.
Splunk© is the world's first Data-to-Everything Platform. Now organizations no longer need to worry about where their data is coming from, and they are free to focus on the business outcomes that data can deliver. Innovators in IT, Security, IoT and business operations can now get a complete view of their business in real time, turn data into business outcomes, and embrace technologies that prepare them for a data-driven future.
In this tutorial, we'll go over the basics of AbuseIPDB's integration with Splunk.
Introduction
The AbuseIPDB app for Splunk integrates AbuseIPDB's API endpoints with Splunk, enabling you to quickly and accurately perform threat analysis on IP addresses. The integration currently adds several search commands that can be used to, for example, check IP addresses for abuse by returning an "abuseConfidenceScore" that represents how confident AbuseIPDB is that the given IP is abusive. You can also report IPs yourself, check reports made against IPs, and setup a Splunk lookup that stays up-to-date with the AbuseIPDB IP blacklist, representing the most abusive IPs currently in the database.
The API reference which makes up the bulk of the integration can be found here.
Pre-Requisites - Before You Start This Tutorial
Create an AbuseIPDB API v2 key
Before starting this tutorial, we assume that you have an account registered with AbuseIPDB, and have verified your domain and created an API v2 key. The API is free to use, but you do need to create an account first.
Download and set up Splunk©
Visit the Splunk© download page  and select your Operating System for the proper download link.
Ensure that Splunk© Web is up and running
For information on starting Splunk© for the first time and launching Splunk© Web, visit their Documentation.
Install the app
- Once you are on Splunk© Web, navigate to Apps > Manage Apps.
- Click "Browse more apps"
- Search for the AbuseIPDB App, our official integration
- Click Install
Setup
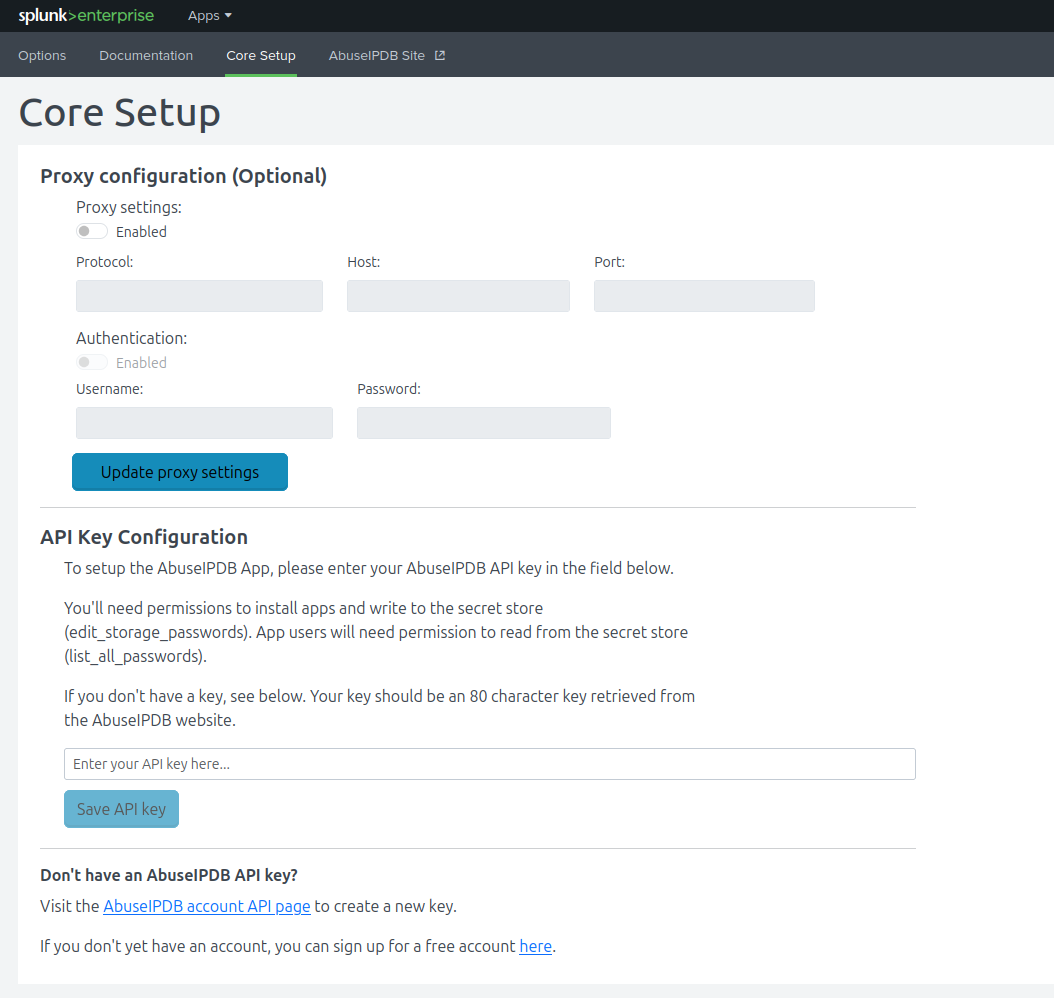
To use the AbuseIPDB App, you must enter your API key on the setup page. If you are viewing this documentation, you have already done so.
If you wish to change the API Key you have saved, please go to the AbuseIPDB Core Setup tab and repeat the setup process.
There, you can also configure the proxy the app will use. If enabled, all requests will go through the proxy.
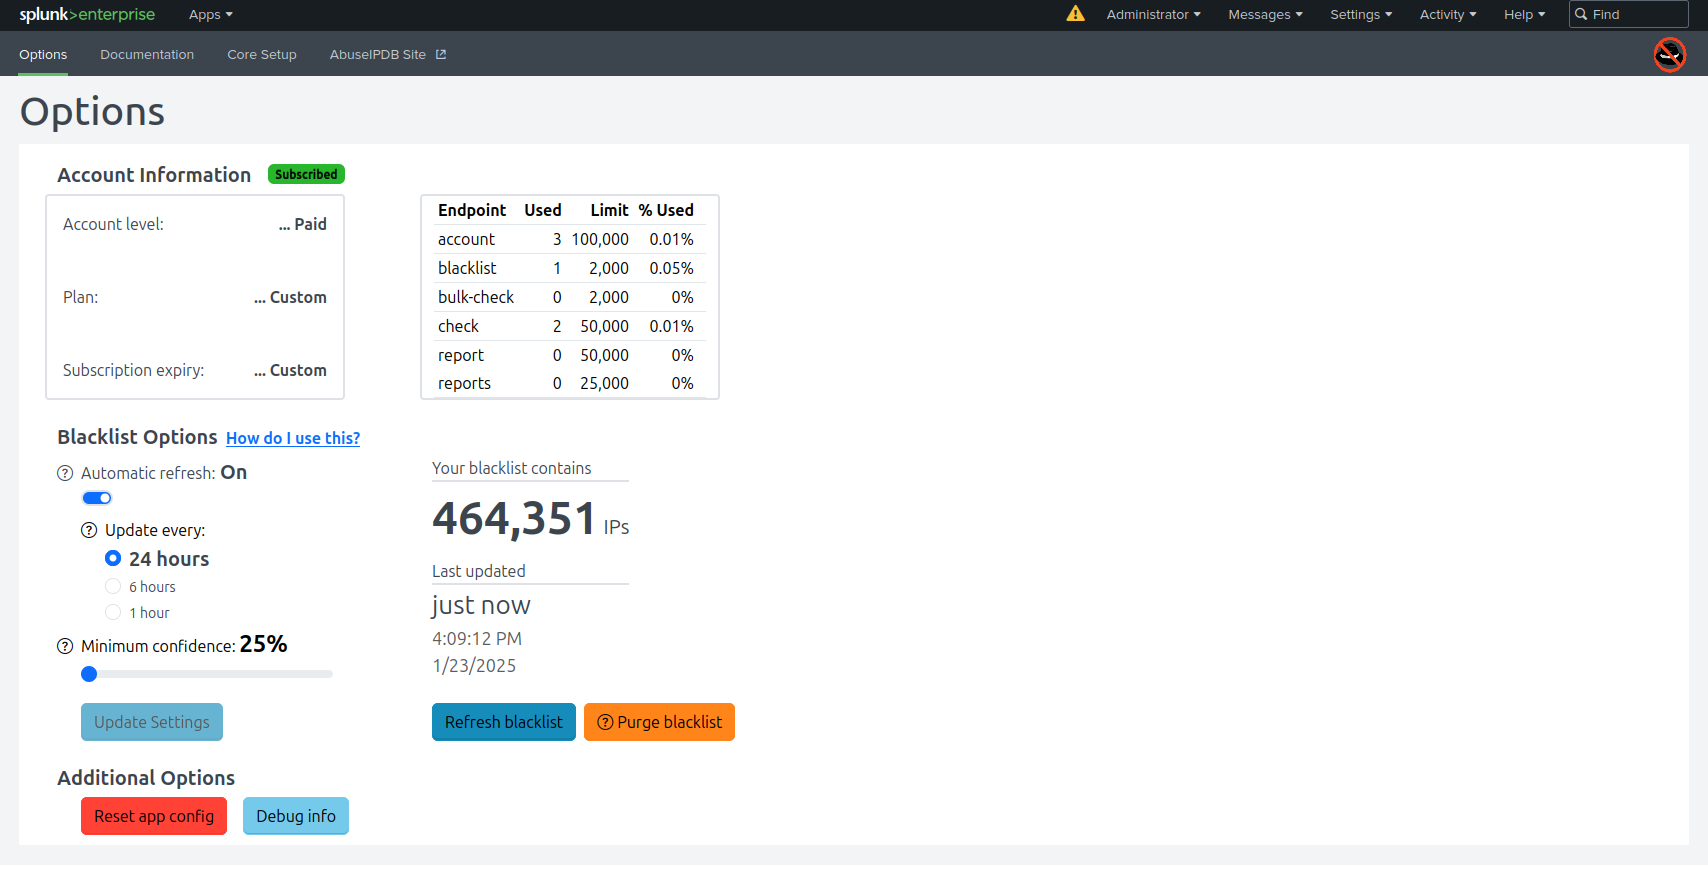
Options, including automatic blacklist settings, are in the Options tab.
If you want to add a workflow action to check IPs with AbuseIPDB, you can! Simply go to "Fields" in the Splunk UI, then add a new workflow action. Set:
- Label: Check $ip$ with AbuseIPDB
- Apply only to: ip
- Search string: |makeresults|abuseipdbcheck ip=$ip$
Quick Start
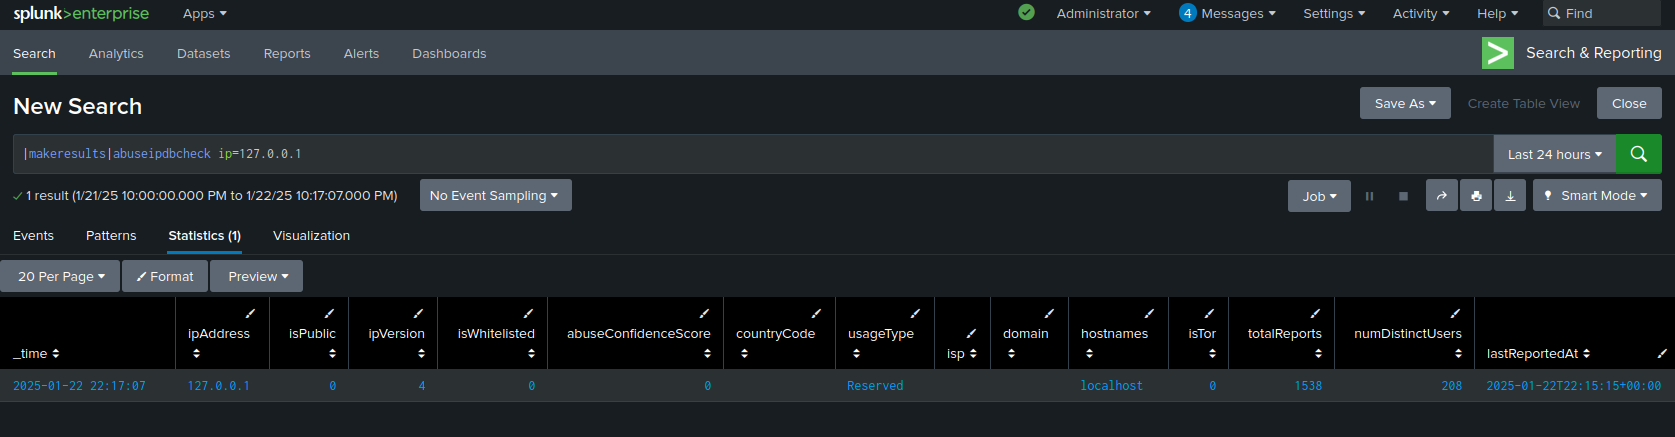
Use the abuseipdbcheck custom search command to check an IP for abusive behavior using our API. Example usage:
|makeresults
|abuseipdbcheck ip=127.0.0.1
Use the abuseipdb reports command to retrieve up to 500 of the most recent reports made against an IP. Example usage:
|makeresults
|abuseipdbreports ip=127.0.0.1
Go to the options page and enable automatic blacklist updates to use our blacklist API. You'll then be able to check IPs against a Splunk KV store which maps IPs to an abuse confidence score, among other values. Example usage: here.
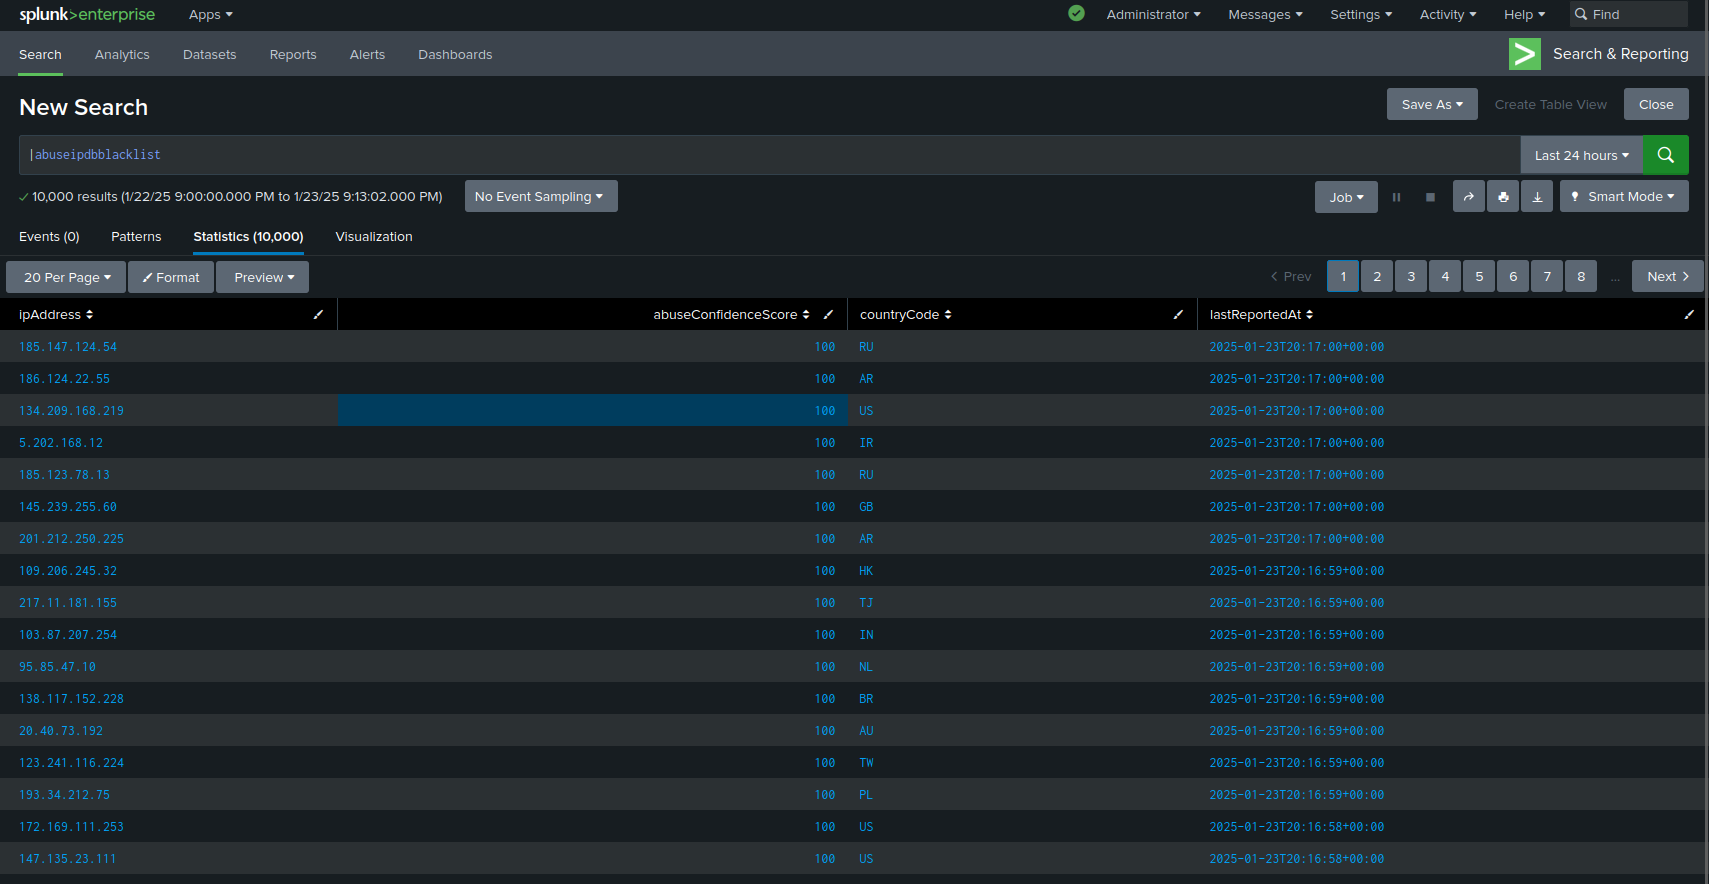
You can also retrieve a one-off copy of the latest blacklist to check IPs against, but keep the default limit of 10,000 in mind. Example usage:
|makeresults
|abuseipdbblacklist
Check Search Command:
The abuseipdbcheck command is a custom search command that allows you to pass in IP addresses either directly as a parameter or from events as a fieldname and get custom AbuseIPDB fields representing data about each IP added to those events after a request to the AbuseIPDB API.
The syntax of the command is:
|abuseipdbcheck ip=(fieldname or ip_address) maxAgeInDays=number verbose=number
Parameters Explained
- ip: Either a field name containing the IPs to check, or an IP address directly.
- maxAgeInDays: (Optional) An integer between 1 and 365 days for the range of reports to include if verbose is set. Default is 30 days.
- verbose: (Optional) An integer value to set verbose flag, which will include reports in response. By default flag is not set. Generally, abuseipdbreports should be used instead.
Fields Added After Check Command
After IPs are sent to the API with the check search command, the response adds fields to directly to the event for each IP. The fields added are based on the body of the response from the check request, so you will have access to the same fields you would making a request directly to the API. These fields can be passed to another search command. This can be useful for taking information from the check results, like the abuseConfidenceScore, and using it to make decisions in your application. See below for examples.
The following fields are added to search events when the check command is used:
abuseConfidenceScore
ipAddress
isPublic
ipVersion
isWhitelisted
countryCode
usageType
isp
domain
hostnames
isTor
totalReports
numDistinctUsers
lastReportedAt
Be advised that each individual IP address passed to the check command will result in an individual call to the API. This means if a field of 1000 IPs is passed to the check command, 1000 synchronous API calls will be made, which can take ten or more minutes to resolve. If possible, check IPs as you receieve them instead of in one batch. Also, when using the check command on sets of IPs, keep in mind the daily limits on API usage. You can reference our limits here or in the AbuseIPDB App options page.
Sample Usage
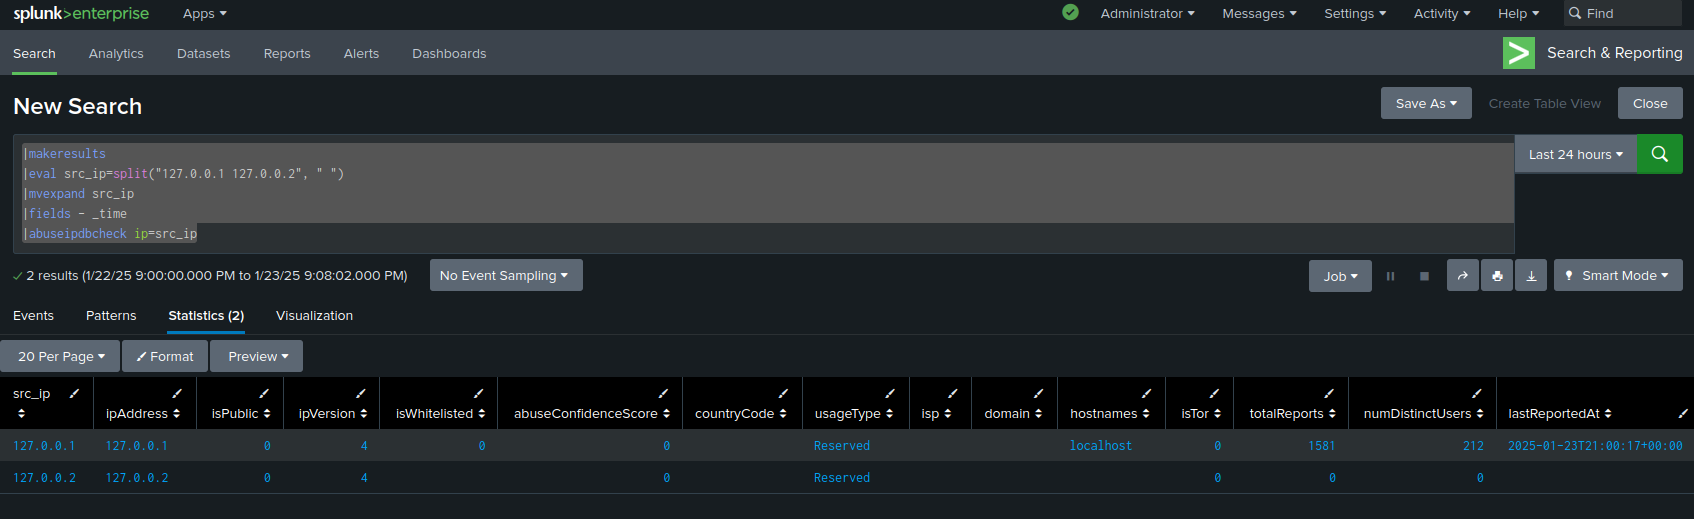
The following example will demonstrate pulling IPs from a log file, passing them through the check command, and viewing the results.
Run the search:
source="/var/log/secure"
|rex (?<ip>\d+\.\d+\.\d+\.\d+)
|abuseipdbcheck ip=ip
|table ip, abuseConfidenceScore
which will output a table showing the ip address and abuseConfidenceScore
of each ip extracted. In the above example, we are using a regex to extract ips into the ip field, which is
passed to the check command. To filter the results, you could add a where clause like |where
abuseConfidenceScore >= 50.
Reports Search Command:
The abuseipdbreports command is a custom search command that allows you to pass in IP addresses either directly as a parameter or from events as a fieldname and get custom abuseIPDB fields representing up to 500 reports made against those IPs returned in a table after a request to the API.
The syntax of the command is:
|abuseipdbreports ip=(fieldname or ip_address) maxAgeInDays=number numReports=number
Parameters Explained
- ip: Either a Splunk field containing IPs to get reports on, or an IP address directly.
- maxAgeInDays: (Optional) An integer between 1 and 365 days for the time range to check. Default is 30 days.
- numReports: (Optional) An integer between 1 and 500 indicating how many reports to return for the given IP, sorted by latest. Default is 100.
Fields Added After Reports Command
After IPs are sent to the API with the reports search command, the response will add rows to the results table where each row represents a single report made against a given IP. You can use these rows to perform additional analysis on IPs like finding the top report categories for a given IP. See below for an example.
The following fields are returned in the results table when the reports command is used:
ipAddress
reportedAt
comment
categories
reporterId
reporterCountryCode
reporterCountryName
Be advised that each individual IP address passed to the reports command will result in an individual call to the API. This means if a field of 1000 IPs is passed to the reports command, 1000 synchronous API calls will be made. If possible, access IPs as you receieve them instead of in one batch. Also, when using the reports search on sets of IPs, keep in mind the daily limits on API usage. You can reference our limits here or in your AbuseIPDB App options page.
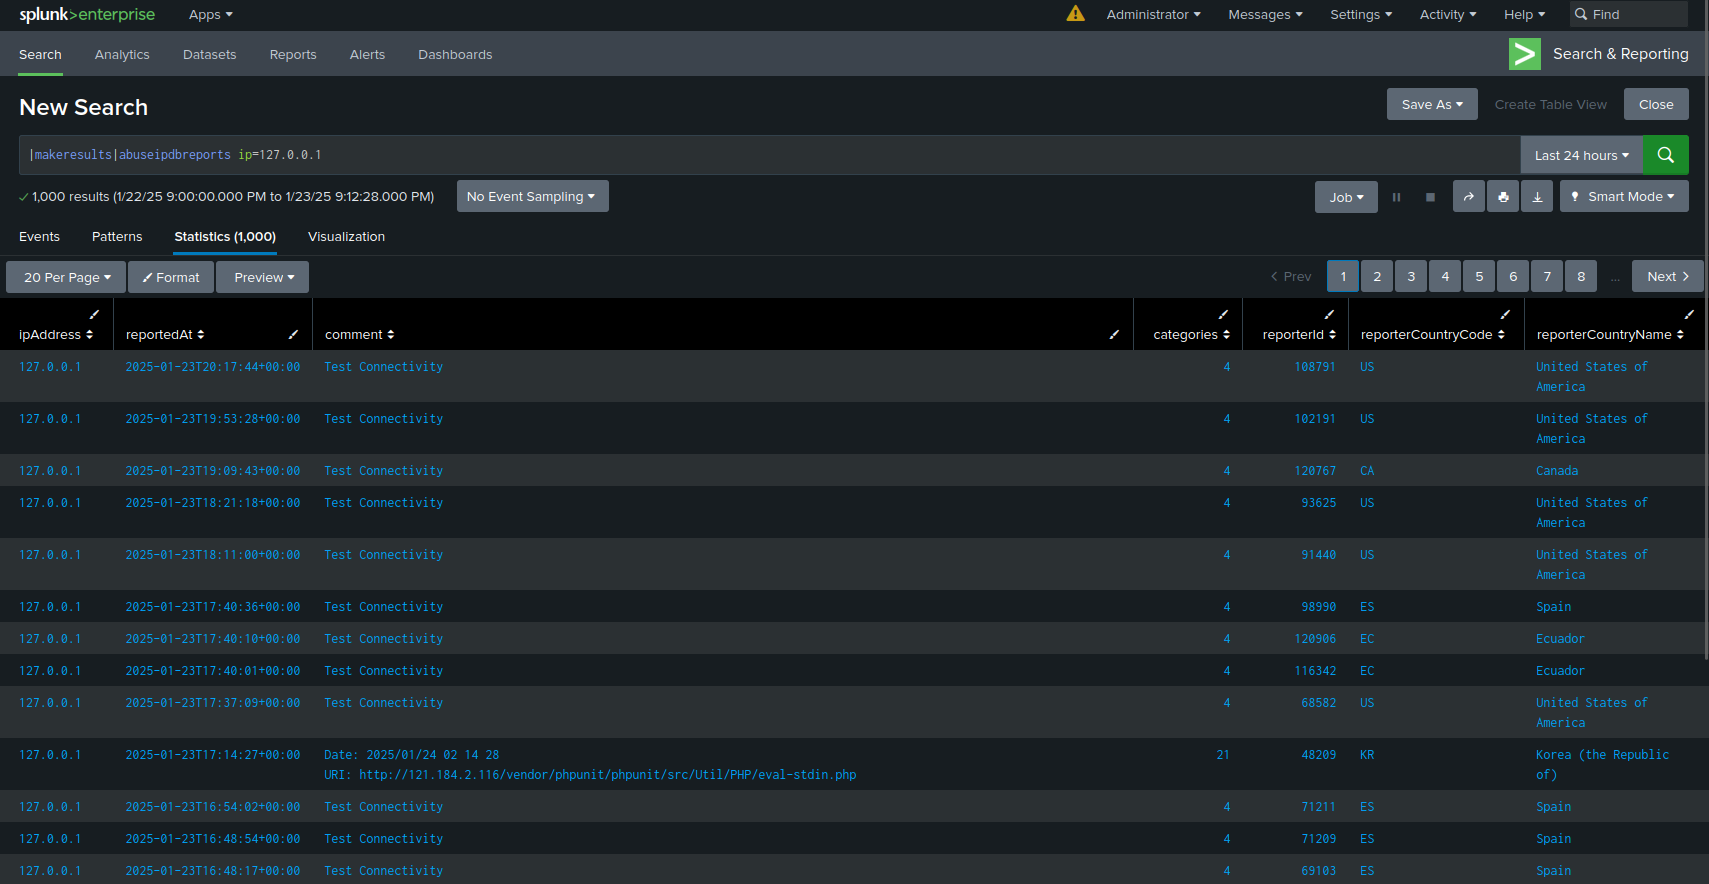
Sample Usage
The following example will demonstrate using the reports command, and viewing the results.
Run the search:
|makeresults
|abuseipdbreports ip="127.0.0.1"
which will display the results of the reports query. If you wanted to then find out what the IP was reported for, you could add this to the last commands:
|stats count by categories
|rename categories as category
|sort - count
Report Search Command:
The abuseipdbreport search command allows you to report IP addresses to AbuseIPDB using a Splunk search. This is a quick and useful way to make reports to the API while in Splunk. Additionally, this command will provide fields from the API response, which can help enrich your data through the search pipeline.
The syntax of the command is:
|abuseipdbreport ip=(fieldname or ip_address) categories=string_of_numbers comment=string timestamp=iso_8601_timestamp
Parameters Explained
- ip: Either a Splunk field containing IPs to report, or an IP address directly.
- categories: A number or quote-enclosed string of numbers representing the report categories.
- comment: (Optional) A string with further information regarding the abusive action.
- timestamp: (Optional) ISO 8601 timestamp for when the abuse occurred.
Note about categories parameter:
If you are only reporting for one category, you may pass just the number, as in form categories=5. However, if you are reporting more than one category, you must pass the list of numbers in a comma-separated list enclosed in double quotes, like categories="2,3,4". This ensures the categories are read correctly. For more information about the AbuseIPDB reporting categories, visit here.
Fields Added After Report Command
After IPs are sent to the API with the report search command, the response adds fields to directly to the event for each IP. The fields added are based on the body of the response from the report request, so you will have access to the same fields you would making a request directly to the API. These fields can be passed to another search command.
The following fields are added to search event when the report command is used:
ipAddress
abuseConfidenceScore
Be advised that each individual IP address passed to the report command will result in an individual call to the API. This means if a field of 1000 IPs is passed to the report command, 1000 synchronous API calls will be made. If possible, report IPs as you receieve them instead of in one batch. Also when using the report command on sets of IPs, please remember the daily limits on API usage. You can reference our limits here or in your AbuseIPDB App options page.
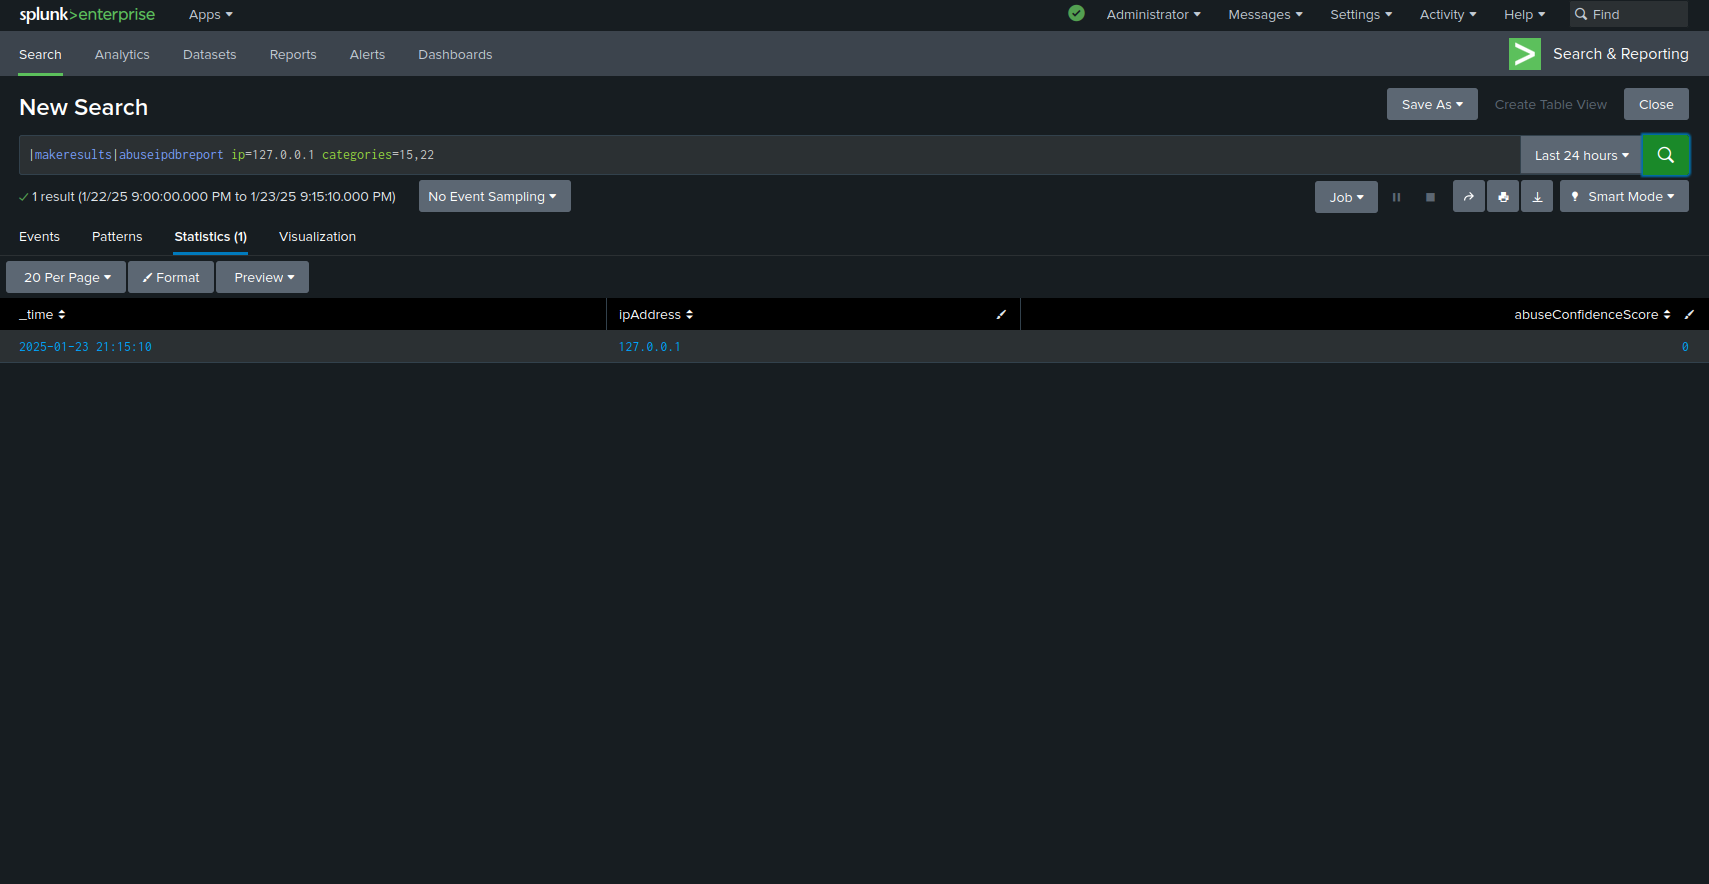
Sample Usage
The following example will demonstrate using the report command.
Run the search:
|makeresults
|abuseipdbreport ip="127.0.0.1" categories="2,3"
which will display the result of the request in the Splunk results area.
Blacklist Lookup:
Unlike the other API endpoints, the AbuseIPDB blacklist can be integrated directly into Splunk as a Key-Value store. It can then be accessed with a lookup. Your blacklist is empty by default- you can fetch the current blacklist by going to the "Options" page and pressing the "Refresh Blacklist" button. Afterwards, you can run commands like:
|makeresults
|eval ip="INSERT_SUSPECTED_IP_HERE"
|table ip
|lookup abuseipdb_blacklist_lookup ip
or, alternatively:
|inputlookup abuseipdb_blacklist_lookup where ip="INSERT_SUSPECTED_IP_HERE"
These will return a table with the following colums:
ipAddress
abuseConfidenceScore
countryCode
lastReportedAt
with the latter three fields being matched against the given IP in the AbuseIPDB app internal KV store (if found). You can test it yourself using any of the recently reported IPs found on our homepage. This functionality is particularly powerful when combined with abuseipdbcheck, which can check IPs which aren't found in the blacklist:
|makeresults
|eval ip="KNOWN_GOOD_IP"
|table ip
|lookup abuseipdb_blacklist_lookup ip
|appendpipe
[where isnull(abuseConfidenceScore)
  |abuseipdbcheck ip=ip
  |table ip, abuseConfidenceScore, countryCode, lastReportedAt
  |fillnull value=---]
|selfjoin ip
Because the IP is not found in the local blacklist, an API call is made to abuseipdb to check it. This keeps your API calls to a minimum and maximizes the speed of your IP checks.
If you want to check multiple IPs in a similar manner, for example from a linux secure log, you can do so like this:
source="var/log/secure" ("failure" OR "invalid" OR "failed" OR "break-in")
|rex field=_raw "(?<ip>\d+\.\d+\.\d+\.\d+)"
|stats count as occurences by ip
|sort-occurences
|head 10
|lookup abuseipdb_blacklist_lookup ip
|eval inBlacklist=if(isnotnull(abuseConfidenceScore), "true", "false")
|appendpipe
[where isnull(abuseConfidenceScore)
  |abuseipdbcheck ip=ip
  |table ip, abuseConfidenceScore, countryCode, lastReportedAt
  |fillnull value=---]
|selfjoin ip keepsingle=true
The options page provides settings for more fine-grained control of the incoming blacklist. You can retrieve only IP addresses that are above a certain confidence score for abuse, and you can change how often the blacklist updates. Keep in mind that some of these features are available only to AbuseIPDB subscribers.
Blacklist Search Command:
If you'd prefer, you can also access a copy of the latest blacklist using a search command as a one-off. This can be useful if you need to cross check groups of IPs against the blacklist without having to enable automatic updates. Remember that the command returns 10,000 IPs by default. If you're on a paid account, you can set the limit parameter to retrieve more IPs.
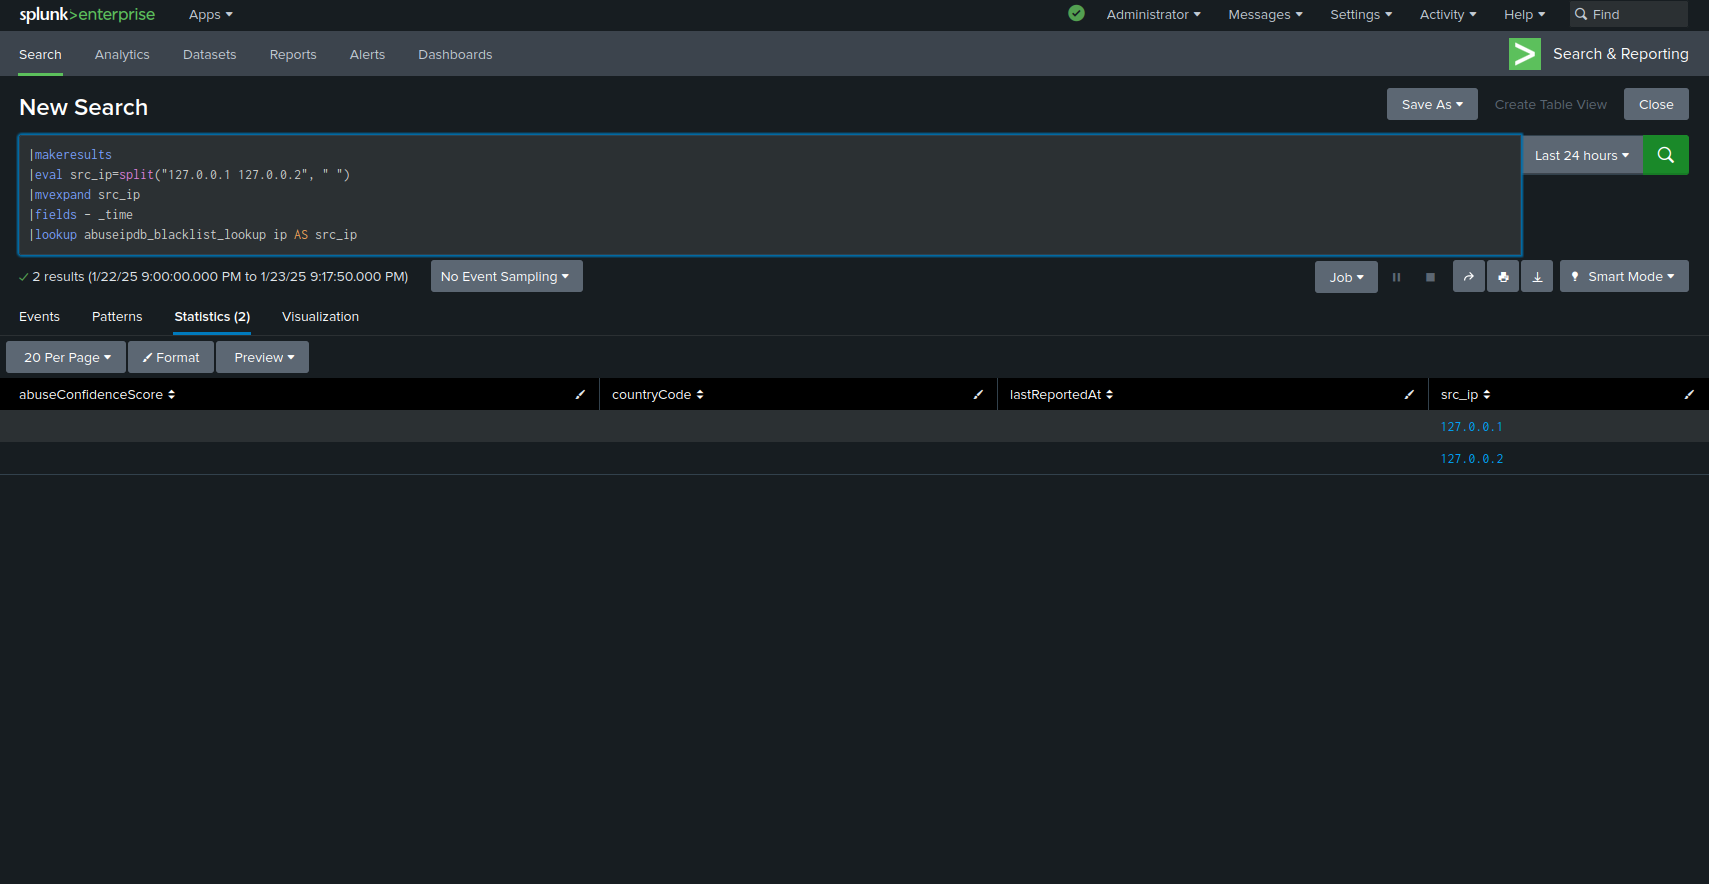
For example, say you have a list of IP addresses in a column named IP:
|makeresults
|eval ip=split("127.0.0.1 192.168.1.1", " ")
|mvexpand ip
|fields - _time
You can join these IPs with the latest AbuseIPDB blacklist as follows:
|join left=L right=R where L.ip=R.ipAddress [abuseipdbblacklist]
      |fields - R.ipAddress
Keep in mind that you'll quickly reach your daily blacklist quota if you misuse this command. Again, we recommend using the KV store instead as explained above.