


Connect Splunk Enterprise Security to AbuseIPDB threat intelligence
Splunk Enterprise Security is Splunk's SIEM. It polls TAXII 2.1 servers through its threat intelligence framework, so AbuseIPDB's crowdsourced IP threat indicators arrive as a threat intelligence source alongside your other intelligence. Tested end to end against AbuseIPDB.
AbuseIPDB is a crowdsourced database of IP addresses reported for abuse, such as brute-force logins, port scans, spam and web attacks. Its STIX/TAXII feeds deliver those addresses in STIX 2.1, the standard format threat intelligence tools exchange, over TAXII 2.1, the protocol those tools use to fetch it. Each address arrives as an indicator with its 0–100 confidence score, so you can check your logs against addresses other organizations have reported.
Already pull the AbuseIPDB blacklist through the API? Free and Paid feeds draw from that same blacklist, delivered straight into your SIEM or threat intelligence platform instead of to a script, and your check and blacklist integrations keep working as before. Your client signs in with your account email and one of your existing API keys. STIX/TAXII feeds are bought separately from your API plan and have their own daily indicator allowance; during the beta, accounts on a paid API plan can try one free feed first, with up to 10,000 indicators a day of addresses scoring at least 100. See Plans.
Already use the AbuseIPDB app for Splunk (Integrating AbuseIPDB with Splunk)? That app calls the API with your API key, so its lookups count against your API daily limits. This feed instead loads reported addresses into Enterprise Security's threat intelligence, where its threat matching can use them with no API calls. You can use both.
Before you start: a feed on My TAXII Feeds using the IP threat indicators output format (you need its collection URL), an API key, and Splunk Enterprise Security installed and working.
- In Enterprise Security open Configure > General > Credentials and select
New credential:
- User: your AbuseIPDB account email.
- Realm: leave blank.
- Password: any API key on your account.
- App: Enterprise Security.

The credential Splunk uses to authenticate against the feed. - Open Configure > Intelligence > Threat intelligence
sources, select New and add a TAXII 2 source. On the General tab:
- Name / Description: any label, e.g.
AbuseIPDB. - Url:
https://taxii.abuseipdb.com/taxii2/abuseipdb-taxii2/collections/{collection-id}/, using the feed's Collection ID from your My TAXII Feeds page, or copy the whole URL from the feed's ⋯ > Copy collection URL menu. - TAXII2 Version: 2.1.
- Interval:
3600, the seconds between polls, on the Free and Paid plans; on Enterprise, your agreed interval (see recommended polling). - Max Age:
-60d, how long Splunk keeps the indicators. Indicators also carry their own expiry,valid_until, calculated from the latest reported time of attack; the two are separate and can end on different dates. - POST arguments:
earliest=-7d, how far back Splunk starts on its first poll. Use up to-60dto backfill the whole look-back window. Only Enterprise feeds use it; Free and Paid feeds ignore it. - Threat Intelligence: leave checked.
- Leave the remaining fields at their defaults.
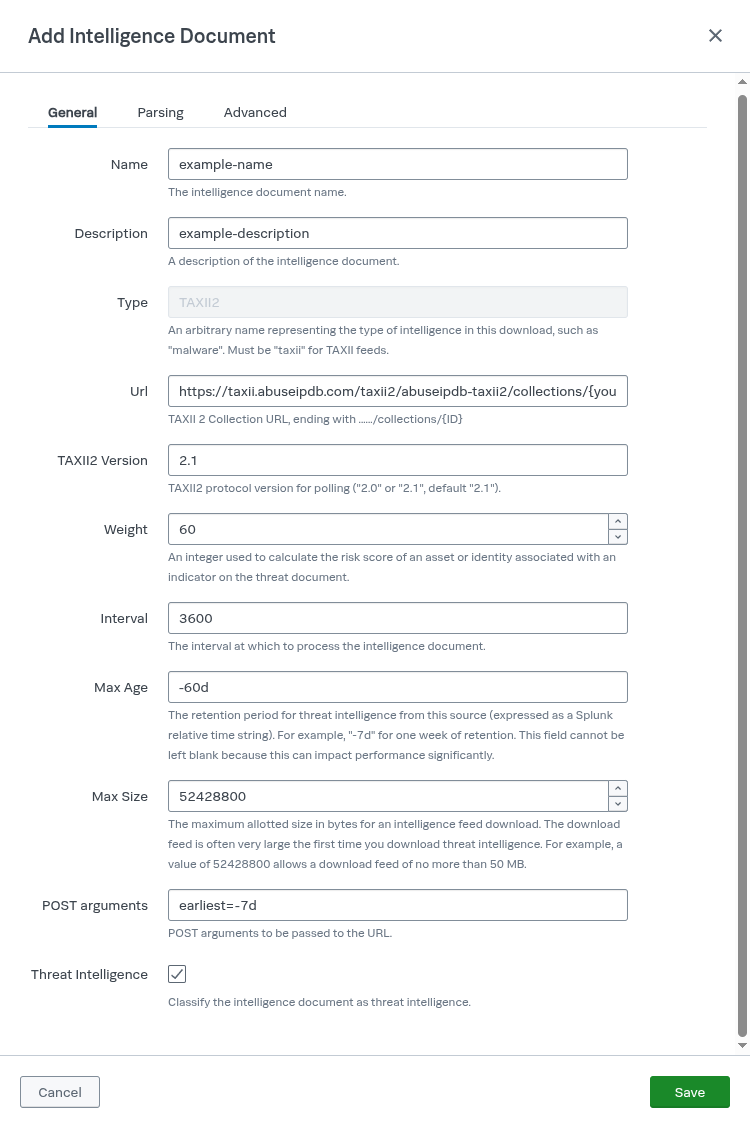
The General tab, pointed at an AbuseIPDB feed collection. - Name / Description: any label, e.g.
- On the Advanced tab set Remote site user to the User from step 1. Leave
Remote Site User Realm blank, then save.
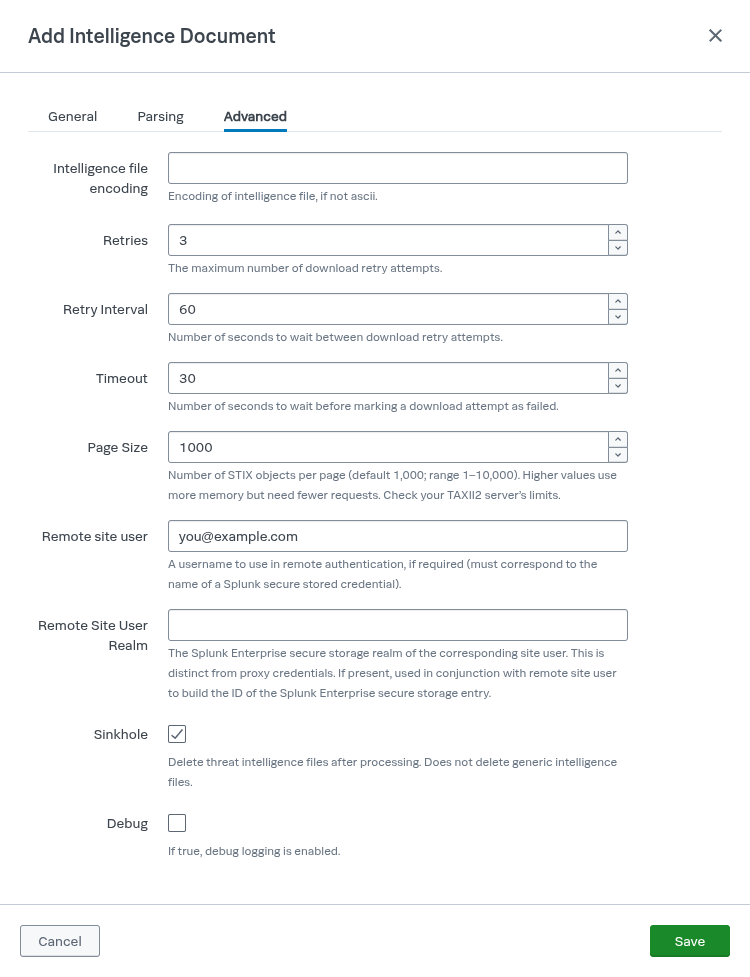
The Advanced tab; Remote site user must match the credential User exactly. - After the first poll, the feed's Last accessed date on My TAXII Feeds shows today (it is recorded once per UTC day). Then confirm on the Threat Intelligence Audit dashboard that the AbuseIPDB source has downloaded and parsed indicators. No date or no indicators? See Errors.
Output format
Use the IP threat indicators output format, the one tested with Splunk Enterprise Security. It carries the confidence score, country, ISP, usage type and report count as indicator labels (free-plan feeds carry only the confidence score, country and blacklisted labels). The other output formats have not been tested with this integration, and their extra graph objects, sightings and extension fields are not expected to add usable context. The extended format also moves the country into a STIX extension, so Splunk is expected to lose the country label.
Multiple feeds
Each custom feed has its own Collection ID, so each feed is its own source with its own collection URL.
Exact field labels vary by Enterprise Security version; the required values (collection URL, email, API key) are the same.
If it doesn't work
- Last accessed still shows Never or an older date: your client hasn't reached the feed yet. Check the URL, Collection ID or title against My TAXII Feeds, and that the password is one of your API keys, not your account password. Last accessed is recorded once per UTC day and shown in your local time, so if you are behind UTC it can show yesterday's date.
- Last accessed shows today but nothing arrived: look up the status code your client logged under Errors. A 200 with no objects means nothing matched yet or, on Free and Paid feeds, that today's indicator cap is used up.
- Still stuck? Contact us with your client's error message.